Measles Dynamics in England and Wales
Travelling epidemic waves of measles: core-satellite dynamics and the impact of vaccination
By pointing at the picture and selecting "save as" in your browser you can download the 3.2MB version of the movie showing the dynamics of measles in England and Wales during the period 1955-1965.
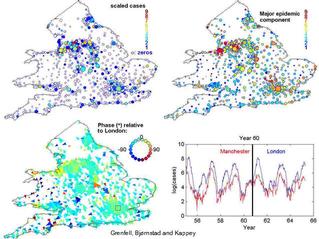
In the upper left quadrant of the movie the dynamics of the measles is displayed using colour coding for the logarithm of the number of reported infected cases. The data show the typical bienial cycles of measles dynamics. The upper right quadrant shows the data after being filtered using wavelets in a window of 1.5 to 2.5 years. Out of these data one can extract the phase difference with respect to London of the major component of the time series. This is displayed in the lower left quadrant. The arrows and the colour of the arrows are indicators of the phase difference.
The lower right quadrant shows the time series of London and Manchester.
The format of the movie is flic, because flic allows for high compression of the data. Windows users can watch the movie using e.g. PowerFlic or AAplay (140kB) . Unix users may use e.g. xanim to view the movie.
References
[1] B. T. Grenfell, O. N. Bjornstad and J. Kappey, Nature 414, 716-723 (2001).
jens kappey
Last modified: Wed Mar 27 10:58:26 GMT 2002